Values Data Groupings - Data Labels tab
Data labels are descriptive texts displayed over data points. Following is a description of the data labels properties:
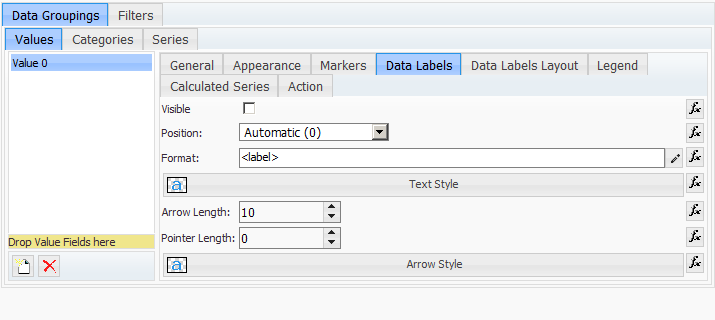
Visible - specifies whether data labels are visible or not. By default set to false.
Position - controls the position of the data labels relatively to the shape used to display the data point. Possible values are:
- Automatic - in this mode the actual position of the data labels is determined by the chart area chart type. The documentation of each chart type specifies the meaning of this setting in the context of the chart type.
- Top - the data label is displayed at top of the data point.
- Center - the data label is displayed at the center of the data point.
- Bottom- the data label is displayed at the bottom of the data point.
Format - specifies the format of the text displayed in the data point. See the Data Point Formatting Commands topic for a complete discussion on the commands, which can be used.
Text Style - controls the appearance of the data label text.
Arrow Length - controls the length of the arrow, which connects the data label with the data point.
Pointer Length - for data labels which are connected to the data point with a two step link the pointer length controls the length of this second segment (for example a Pie chart in Spider label mode).
Arrow Style - controls the appearance of the arrow link, which connects the data point with the data label.
Fit Mode - allows you to specify the fit mode for the generated data labels. Possible values are:
None - no fitting is applied to the generated data labels. Labels can still include explicit line breaks.
Wrap - the data labels width is capped to the Max Width setting. Each line in the data label is word wrapped so that its width does not exceed the Max Width setting.
Max Width
Specifies the maximum allowed width of the labels when the Fit Mode setting is set to Wrap.